Debugging memory usage in a live Python web app
I worked on a Python web app a while ago that was struggling with using too much memory in production. A helpful technique for debugging this issue was adding a simple API endpoint that exposed memory stats while the app was running.
Enter Pympler
There’s a great module called Pympler for debugging memory stats in CPython. It walks your process heap and reports the object types, number of objects, and their size in bytes for all allocated Python objects.
The following function generates a memory summary using Pympler and returns it as a string:
def memory_summary():
    # Only import Pympler when we need it. We don't want it to
    # affect our process if we never call memory_summary.
    from pympler import summary, muppy
    mem_summary = summary.summarize(muppy.get_objects())
    rows = summary.format_(mem_summary)
    return '\n'.join(rows)
Let’s plug this into an example app that allocates some memory and then calls memory_summary:
"""
Don't forget to $ pip install pympler.
"""
import sys
from StringIO import StringIO

def memory_summary():
    # ... (see above)

# Allocate some memory
my_str = 'a' * 2**26
class MyObject(object):
    def __init__(self):
        self.memory = str(id(self)) * 2**10
my_objs = [MyObject() for _ in xrange(2**16)]

print(memory_summary())
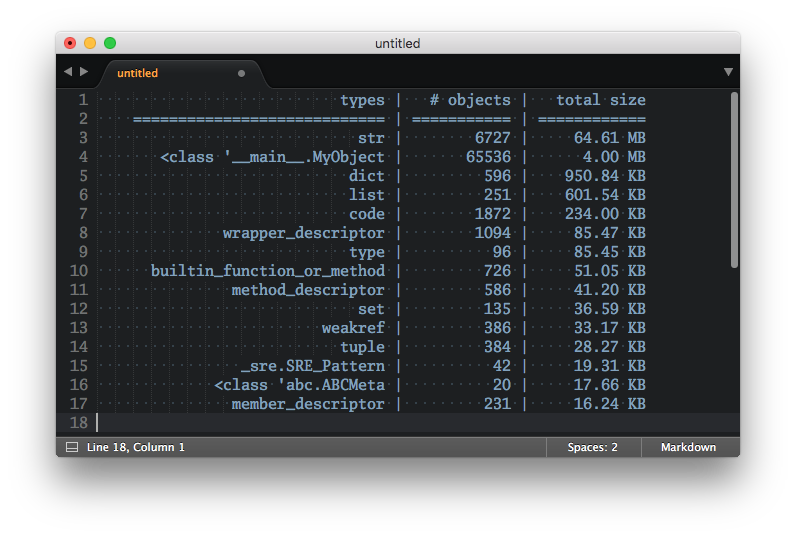
Running this example will result in a printout like the one below, which should give you a rough idea which objects are taking up the most space in your app:
                       types |   # objects |   total size
============================ | =========== | ============
                         str |        6727 |     64.61 MB
   <class '__main__.MyObject |       65536 |      4.00 MB
                        dict |         596 |    950.84 KB
                        list |         251 |    601.54 KB
                        code |        1872 |    234.00 KB
          wrapper_descriptor |        1094 |     85.47 KB
                        type |          96 |     85.45 KB
  builtin_function_or_method |         726 |     51.05 KB
           method_descriptor |         586 |     41.20 KB
                         set |         135 |     36.59 KB
                     weakref |         386 |     33.17 KB
                       tuple |         384 |     28.27 KB
            _sre.SRE_Pattern |          42 |     19.31 KB
         <class 'abc.ABCMeta |          20 |     17.66 KB
           member_descriptor |         231 |     16.24 KB
For example, we see that the str objects we allocated take up the biggest chunk of memory at around 65 MB. And as expected, there are also 2^16 = 65536 MyObject instances, taking up 4 MB of space in total.
But how can we access this information in a production web app?
I ended up just exposing the output of memory_summary() as a /debug/memory plaintext endpoint secured with HTTP basic auth. This allowed us to access the allocation stats for the app while it was running in production.
A more advanced way to track these stats in a production web app would be to feed them into a service like DataDog to plot and track them over time. However, in many cases a simple solution like printing the stats to the application log might suffice.
Please also note that these stats are per interpreter process. If you’re running your web app as multiple CPython processes behind a load balancer (like you should) then you’ve got to be sure to take that into account when making sense of these memory stats.
Still, I found that just getting a rough sample of which objects are taking up the most space gave me a better idea of the memory usage pattern of the app and helped reduce memory consumption with some follow up work.